Source: 2012-15 Import, export data from IndiaChemTrade (Chemical Weekly); 2015-16 data from DGCIS database (a unit price of Rs. 70/kg was assumed to arrive at volumes; Production data-see below.)
PET Production in India
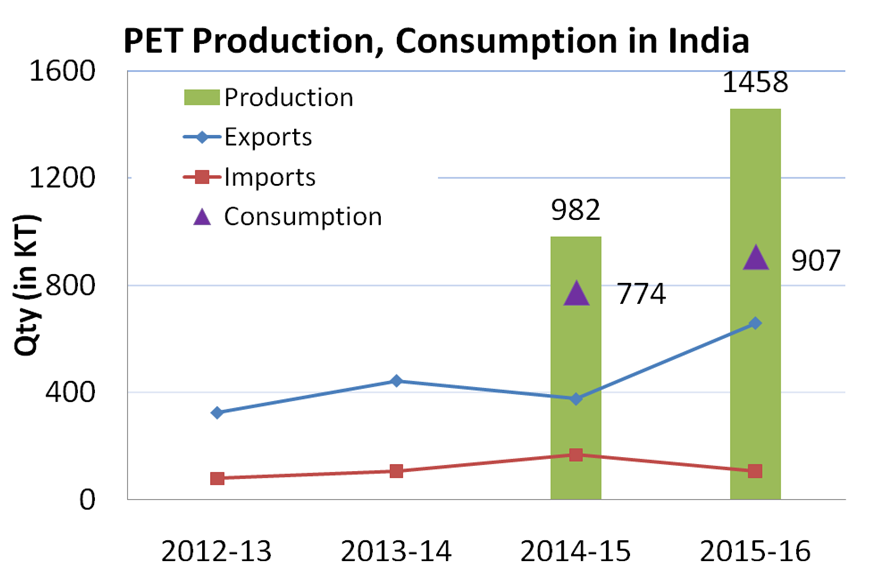
PET production in India has risen steadily over the years. In 2015-16, ~1,450 KT of PET was produced in India (against a total capacity of 1,976 KT), as compared to ~980 KT in 2014-15 (against a capacity of 1326 KT). There are four major manufacturers of PET in India: Reliance Industries Limited, Dhunseri Petrochem and Tea Limited, JBF Industries Limited, Micro Poly Pet Private Limited (now Indorama). Production, capacity details are given in the table below.
Table 1: PET Production in India 2014-16
| 2014-15 Production (in KT) (Total capacity in parenthesis) | 2015-16 Production (in KT) (Total capacity in parenthesis) | |
| RIL^ | 374 (480) | 797 (1130) |
| Dhunseri* | 348 (410) | 396 (410) |
| JBF** | 200 (220) | 200 (220) |
| Micropet# | 60 (216) | 65 (216) |
| Total | 982 (1326) | 1458 (1976) |
^ RIL annual report 2015-16; *http://dhunseritea.com/our-business/petrochem/; Dhunseri Annual Report 2015-16; ** Private communication with a senior executive of JBF at a trade event in Mumbai, Aug 2016; # Indorama acquired MiroPet in 2015; Indorama and Dhunseri have merged to form a single entity in India (effective from late 2016); Capacity data from news articles; Production data estimates based on industry inputs
Import, Export of PET
A large quantity of PET is exported every year. In 2015-16, ~650 KT of PET was exported. The major markets for PET exports from India have been: Bangaldesh, USA, Italy, Israel, Romania, Ukraine, UAE etc. The export volumes have grown in the recent years, closely tracking the overall production levels in India.
To a smaller extent, PET is imported to India. Mainly from Taiwan, China, Iran and Malaysia. In 2015-16, the import figures stood at 107 KT.
PET is imported/exported in various grades. Some of the main categories of PET and the associated HS codes are given below:
| Product Name | HS Code |
| Polyethylene terephthalate [covers all grades] | 390760 |
| Polyethylene terephthalate with intrinsic viscosity <0.64 DL/G | 390760.10 |
| Polyethylene terephthalate with intrinsic viscosity >= 0.64 DL/G & <=0.72 DL/G | 390760.20 |
| Other polyethylene terephthalate (including clean, colourless grades) | 390760.90 |
PET imports also arrive in the form of flakes, textile chips, film grade, semi-dull chips etc., much of which is used for non-bottle applications.
PET is also exported after being converted to preforms and bottles (some after being filled with beverages/liquids). For example, Manjushree Technopak is a large company involved in making prefroms and bottles for various applications, derives 13.7% of their revenues from exports (~8-9 KT per annum). When calculating the actual PET consumed in India, one needs to factor in these inflows/outflows as well.
PET Consumption in India
Using a simplistic formula of
Total domestic consumption = Total domestic production + Imports – Exports,
we can estimate the PET consumed in India in a given year. In the year 2015-16, the total domestic consumption of PET was ~900 KT (as compared to 774 KT in 2014-15). These numbers need to be corrected for the fact that other grades of PET (used in textile and other applications) get imported and PET bottles and preforms get exported (which is not captured in the import/export data) and other such factors. Assuming a downward correction of 5-8% to accommodate for these factors, the domestic consumption of PET in India can be pegged at 830-860 KT for the year 2015-16 (and 710-730 KT for 2014-15).